

Home
|
Local Search Insights|
Local Search Grids + Population Density to Find Growth Opportunities within your service area
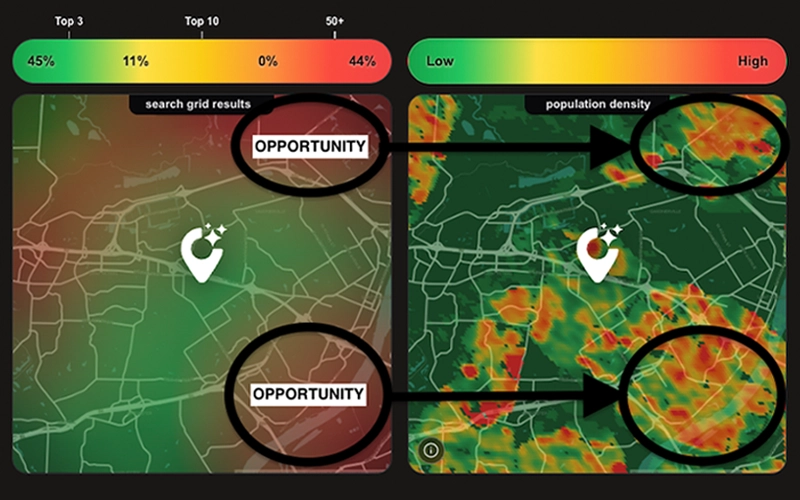
A local search grid answers one of the most useful questions in local SEO: How does a business rank when the searcher moves across the market?
That geographic view is a major improvement over a single city-wide ranking. It exposes the reality that local search visibility can change from one neighborhood to the next. But a traditional local search grid still treats every measurement point as if it carries the same business opportunity. It usually doesn't.
A weak ranking over a lightly populated area and a weak ranking over a dense residential area may look identical on a rank grid. The potential importance of those gaps can be very different. That's why Modfyr is adding Population Density to its local search analysis: a geographic context layer designed to help businesses move from where do we rank? to where could improving our visibility matter most?
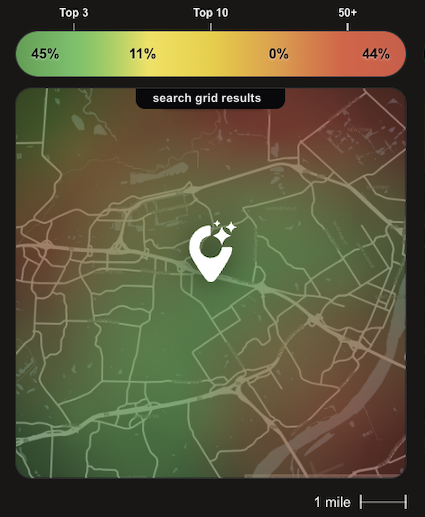
A local search grid measures rankings from multiple geographic points instead of relying on a single search location. Each point represents what a search engine could return for someone searching from that part of the market.
The result is a visual map of local search visibility. Strong rankings may cluster near a business location and weaken with distance, while competitors can lead in other parts of the same market.
This approach has become an established way to analyze local rankings because it reveals geographic differences that a single rank position or city-level average can hide.
Modfyr's Website Results and Maps Results use a nine-point geographic grid covering approximately 72 square miles. The same market footprint makes it easier to compare where a business appears in website results, where it appears in Google Maps results, and where visibility drops off.
That answers an important performance question: Where are we visible?
But rank alone does not tell you how many people live around each part of the grid, whether a weak area overlaps with a meaningful residential concentration, or whether the next optimization effort should focus on one visibility gap instead of another.
Modfyr’s 2026 Local Search Ranking Factors Study measured 148 businesses across nine geographic search points per market. Businesses ranking better near the market center also tended to have broader geographic Search Coverage. This relationship reinforces why a single ranking position is not enough to describe local reach. Population Density adds a different kind of context: where residents are concentrated within the same market. The study did not test population density as a ranking factor.
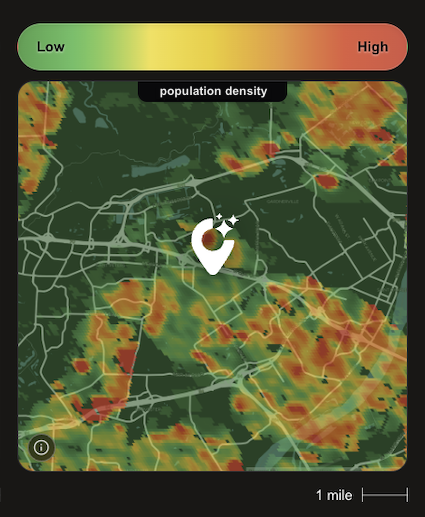
Population Density is displayed across the same geographic market used for local search analysis, allowing ranking patterns to be interpreted alongside where residents are concentrated.
Lower-density areas appear toward green, while progressively higher-density areas move through yellow, orange, and red.
The purpose is not to replace rank tracking. It is to add context to it. A local search grid can tell you that visibility is weak in the northeast part of your market. Population Density can show whether that same area contains relatively few residents or one of the largest residential concentrations in the footprint.
Website and Maps grids show where a business ranks, where it does not rank, and how consistently it appears across the market.
Density helps distinguish between geographic gaps that look similar in rank data but may represent very different potential audiences.

If an underperforming grid area overlaps with higher population density, that does not automatically make it the best growth opportunity. It does make it a stronger candidate for investigation.
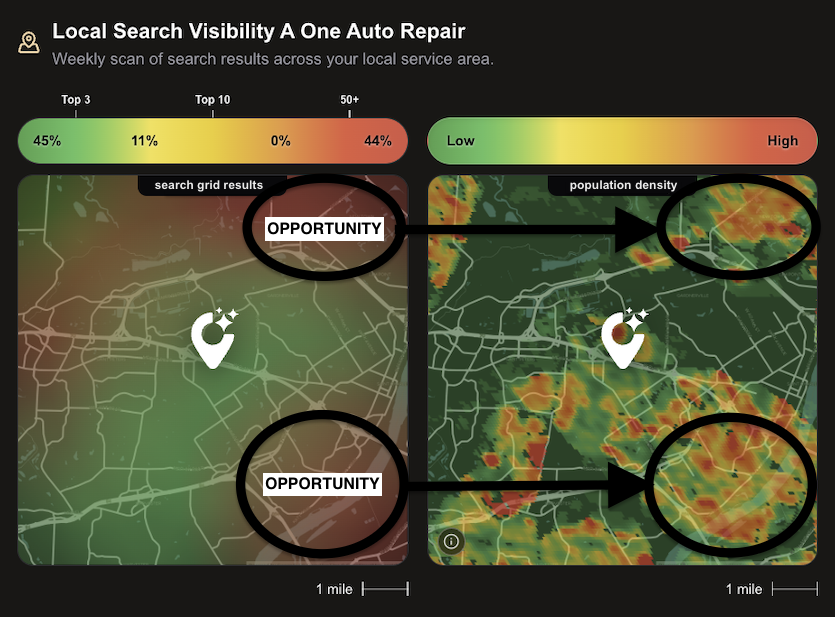
The practical value is prioritization. A conventional local search rank tracker may show ten places where visibility could improve. A density-aware view helps narrow the question: Which of those areas deserve attention first?
For example, imagine two grid points where your Maps rank is equally weak. One sits over a low-density edge of the market. The other overlaps with a much denser residential area. Assuming both are genuinely within your service area, the second gap may warrant closer analysis first.
That's a different use of local search grid data. Instead of treating every red or low-ranking cell as equal, you can evaluate visibility in the context of the market underneath it.
Population density should not be interpreted as keyword demand, customer intent, revenue potential, or a guarantee of conversions. A dense area may still have lower demand for a specific service, stronger competitors, limited service coverage, or demographic characteristics that make it less relevant to the business. Think of density as a prioritization signal, not a demand forecast.
Population density becomes even more useful when paired with Modfyr Compete.

Compete measures the primary business and selected competitors across a shared nine-node market grid. Instead of viewing a competitor only as a city-wide benchmark, you can see where that competitor is stronger or weaker geographically. A competitive loss in a sparsely populated part of the market may be less urgent than a competitive loss in a denser residential area. That creates a more useful sequence of questions:
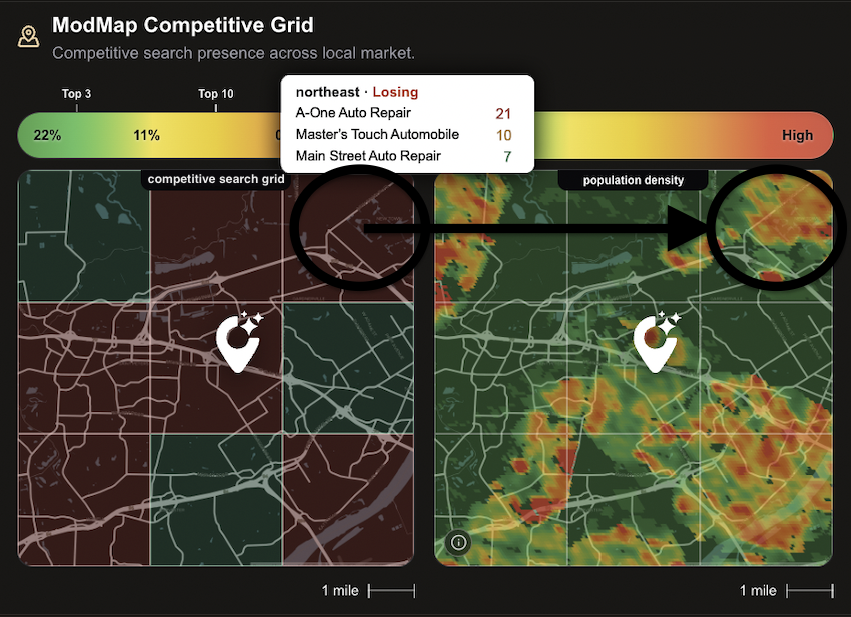
Finding a high-density visibility gap is the beginning of the analysis, not the conclusion. The next step is to understand why the business is underperforming there and whether improving visibility in that area aligns with real business coverage.
Confirm that the business actually serves the area, can fulfill demand there, and wants customers from that part of the market. Population without practical serviceability is not an SEO opportunity.
If Maps visibility is weak but Website visibility is stronger, the issue may point toward Google Business Profile, prominence, proximity, listings, or review signals. If both channels are weak, landing-page relevance and broader authority may deserve more attention.
Related research provides clues about which signals deserve closer investigation. In Modfyr’s website-to-GBP alignment study, businesses with aligned or partially aligned listing information averaged about 61% Total Search Coverage versus approximately 38% with no alignment. The LocalBusiness Schema study found 62% Total Search Coverage among businesses with complete schema versus 31% among those with no qualifying schema. These are observational associations, not evidence that either change by itself will improve rankings in a particular grid cell.
Use Compete to determine whether the same businesses consistently lead the higher-density area. Then compare the signals that may support their visibility, including local content, reviews, listings, business information, structured data, and other relevant factors.
Modfyr’s 148-business local content study found 87% average Maps Search Coverage among businesses with localized website content, compared with 50% without it. This makes meaningful, accurate local content a useful candidate to evaluate when a business has weak visibility in areas it genuinely serves; the result does not establish causation.
Strengthen content and local signals only where they reflect genuine business coverage. Avoid thin city pages or artificial geographic targeting created solely to turn a grid cell green. The goal is to improve usefulness and relevance for customers in areas the business truly serves.
The 11-signal search performance summary also found that review strength produced the clearest single-signal ranking separation, with other signals differing in their relationships to Website and Maps results. That is another reason to use the grid to diagnose opportunities rather than assuming one optimization applies everywhere.
Local search grids are most useful when the measurement footprint stays consistent. Rechecking the same geographic area helps show whether visibility expanded, contracted, or shifted after optimization.
Identify where visibility weakens as searchers move farther from the business and determine whether the most meaningful gaps overlap with populated parts of the true trade area.
Compare ranking coverage with the neighborhoods and communities the business actually serves, especially when physical proximity to a storefront does not define the market.
Use a consistent search-grid framework to compare locations, identify branches with important visibility gaps, and prioritize markets where stronger local search coverage may have the greatest practical value.
Move client conversations beyond a wall of colored rank points. Population density provides additional context for explaining why one geographic weakness may deserve attention before another.
Modfyr makes it easy to get started with local search grid analysis, with additional geographic insights available through its subscription plans.
Whether you are evaluating a single search query or comparing visibility against local competitors, Modfyr helps turn geographic search rankings into practical opportunities for improvement.
The local search grid made geographic rank tracking easier to understand. Modfyr extends that model by connecting Website visibility, Maps visibility, competitor performance, and population density across the same local market. The result is not a claim that more people automatically means more searches or more customers. It is a better framework for deciding where to investigate, where to prioritize, and where improved local visibility could matter most. That is the next step for local search analysis: not simply measuring rankings across a grid, but adding enough market context to turn geographic visibility into a more focused growth strategy.
Get a Free local search analysis at seo.modfyr.com.


{"@context":"https://schema.org","@type":"FAQPage","mainEntity":[{"@type":"Question","name":"What is a local search grid?","acceptedAnswer":{"@type":"Answer","text":"A local search grid measures rankings for a specific search query from multiple locations across a geographic area. It shows how visibility changes depending on where someone searches, rather than relying on one city-wide ranking."}},{"@type":"Question","name":"How does population density improve local search grid analysis?","acceptedAnswer":{"@type":"Answer","text":"Population density adds residential context to a ranking grid. It helps identify where weak Website or Maps visibility overlaps with relatively larger concentrations of residents, so businesses can decide which areas warrant closer investigation."}},{"@type":"Question","name":"Does higher population density mean more local searches or customers?","acceptedAnswer":{"@type":"Answer","text":"No. Population density is not keyword search volume, customer demand, or a forecast of sales. Relevance, search intent, competition, and the business's actual service area still determine whether a geographic gap represents a worthwhile opportunity."}},{"@type":"Question","name":"Can I use a local search grid for free with Modfyr?","acceptedAnswer":{"@type":"Answer","text":"Yes. A free Modfyr account includes local search grid analysis for one search query. Population-density analysis requires a subscription."}},{"@type":"Question","name":"Which Modfyr subscription includes population density?","acceptedAnswer":{"@type":"Answer","text":"The AI Readiness subscription provides Population Density in Query Analysis. The Compete subscription provides population-density context for competitor local search grids."}},{"@type":"Question","name":"How can local search grids help analyze competitors?","acceptedAnswer":{"@type":"Answer","text":"A shared geographic grid shows where your business and selected competitors rank across the same local market. Combining competitive results with population density helps identify which geographic visibility gaps may deserve attention first."}}]}
Start your free trial today—no credit card required.
Still have questions? Please reach out to us at contact@modfyr.com and we'll get back you asap!