

MODFYR RESEARCH · ALL 11 LOCAL SEO SIGNALS
How 11 Local SEO Signals Compared Across 148 Real Businesses
A complete overview of performance across every signal measured in the 2026 Modfyr Local Search Ranking Factors Study.
Brian "BB" Bisges · Modfyr · 2026 Research
This page condenses the study into one comparison chart. Each signal shows Website, Maps, and Total performance for the positive condition versus its comparison group, with the measured difference shown at right.
We analyzed 148 real local businesses and compared 11 commonly discussed local SEO signals with actual Website rankings, Maps rankings, Search Coverage, and Top-10 incidence measured across nine search locations surrounding each business. The chart below puts every signal into the same measurement framework so the observed differences can be compared directly. Click here for reference to how the 'Search Coverage' measurement is determined.
HeaHow 11 Local SEO Signals Related to Performanceding

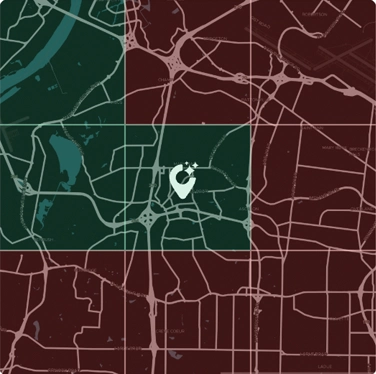
Website Search Coverage
% of 3x3 grids where the business's website ranked in organic search results.
example below = 33% Website search coverage
Maps Search Coverage
% of 3x3 grids where the business's listing ranked in organic Map search results.
example below = 100% Maps search coverage

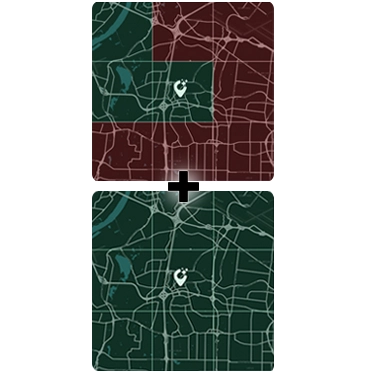
Total Search Coverage
% of total grids where the business website or listing ranked in organic search results.
example below = 67% Total search coverage
Methodology and limitations
This analysis uses the same cleaned 148-business dataset as the 2026 Modfyr Local Search Ranking Factors Study. Each business was measured using one category-relevant local query. Website and Maps visibility were measured from nine search locations across an approximately 72-square-mile area.
For average-rank analysis, businesses not found within the top 50 were treated as rank 51. Search Coverage represents the percentage of measured search locations where the business ranked. Lower rank is better; higher Search Coverage is better.
The findings are observational associations. They do not prove that a specific or individual content change directly causes a ranking or coverage increase.
Explore the complete 148-business Local Search Ranking Factors Study.
Explore all 11 measured signals, rank differences, Search Coverage findings, and signal combinations in the flagship research report.
View the 2026 Local Search Ranking Factors Study →About the 11-Signal Local Search Analysis
What does this chart compare?
It compares 11 audited local SEO signals across 148 real businesses against observed Website and Maps performance. Each signal uses the same core measures: Average Rank, Search Coverage, and the percentage of businesses ranked in the Top 10.
What do Average Rank, Search Coverage, and Top-10 mean?
Average Rank summarizes observed ranking position, with lower values indicating stronger performance. Search Coverage is the percentage of measured search locations where a business ranked. Top-10 shows the percentage of businesses in each cohort that ranked within the first 10 results.
Which local SEO signals are included?
The analysis includes review strength, localized body copy, helpful answers, NAP and hours, Website-to-GBP listing alignment, FAQ content and schema, review content and schema, page word count, keyword alignment, supporting or service links, and LocalBusiness schema.
Why are Website and Maps results shown separately?
A signal can relate differently to Website rankings and Maps visibility. Showing both prevents a strong pattern in one search surface from being hidden by a combined metric and makes those differences easier to compare.
Which signals showed the clearest differences?
Several signals showed substantial differences in this sample, including review strength, localized content, helpful answers, business identity alignment, structured data, and combinations of localized content with helpful answers. Other signals, including raw word count, showed smaller or mixed differences.
What does the combined localized-content and helpful-answers comparison show?
The combined view compares businesses with both signals, businesses with either localized content or helpful answers, and businesses with neither. It provides a simple way to see how search performance differed as those two content signals appeared together or separately.
Does this analysis prove these signals cause better rankings?
No. These are observational associations, not controlled causal tests. Rankings can also reflect competition, proximity, prominence, authority, backlinks, reviews, and other factors that were not fully controlled.